When it comes to impact reports, static PDFs don’t spark action. Personalized videos do. Imagine turning a dusty spreadsheet into 10,000 short, on‑brand videos your members can’t wait to share on Instagram. This guide shows you how—step by step.
TL;DR — Key Takeaways Up Front
- Personalized, co‑branded videos crush static PDFs for engagement and shares.
- One template + clean spreadsheet = thousands of ready‑to‑share clips in days, not months.
- Typical results: 35–55 % watch‑rate, 20–30 % CTR, and share‑rates that climb with a single follow‑up.
- Lean teams can run the entire workflow in‑house—or tap Pirsonal’s experts when bandwidth runs thin.
Why You Should Keep Reading
Weeks of work in InDesign. A gorgeous PDF. And then… crickets.
Here’s what stands in your way:
| Friction point | Fresh data |
|---|---|
| Inbox fatigue | Average business‑email read‑time fell 12 % YoY in 2024 (Litmus State of Email). |
| Social noise | Average daily social media usage of internet users worldwide amounted to 141 minutes per day (Statista, 2025). |
| Report overload | Just 29 % of members say their association is ‘very effective’ at personalizing their experience over time (2024 Association Trends Study). |
Translation: Your content isn’t the problem—it’s the package. Members want fast, personalized highlights they can share with pride. An Automated Impact‑Report, also called, year‑in‑review personalized video, delivers exactly that.
Keep reading for the blueprint, benchmarks, and proof it works.
What Is an Automated Impact‑Report Video (Automated Impact‑Report Video Software & Bulk Personalized Video Generator)?
An Automated Impact‑Report Video (AIRV) is a short, fully‑branded clip (often 15–60 s) that pulls real‑time or spreadsheet‑based metrics—think tonnes recycled, revenue shared, volunteer hours—and turns them into a personalized story for one specific member. They are a variant of personalized year-in-review videos.
Here is an example:
Each video is rendered automatically at scale (hundreds or thousands in minutes), hosted on an individual, personalized landing page, and equipped with tap‑to‑share buttons or a clear, also personalized call‑to‑action.
Key ingredients:
- Data source: CSV/Excel, API, or CRM fields
- Video template: One reusable design with dynamic text, numbers, images, logos
- Automation engine: Pirsonal’s bulk‑render queue
- Distribution: Email, SMS, social DMs, or embedded dashboards—plus direct uploads to social platforms like Instagram, YouTube, X, Facebook, or whichever channels your members actually use.
Why Impact Reports Deserve More Than a Download Link
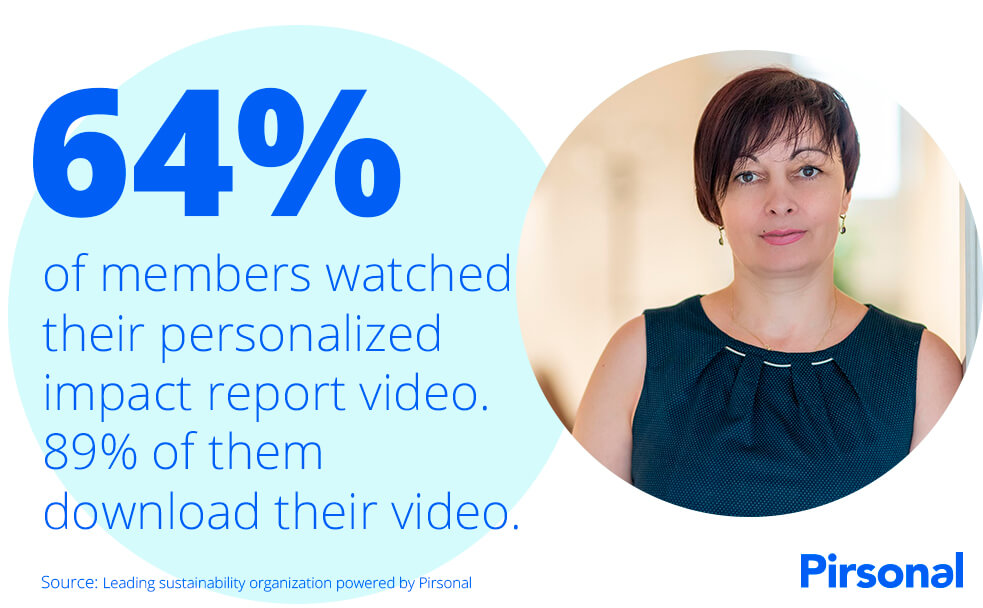
A sustainability organization engaged with 64% of their members with personalized impact report videos powered by Pirsonal
Annual and impact reporting is near‑universal. Most membership‑based organizations publish some form of year‑in‑review or impact report to keep stakeholders informed. However, readership hasn’t followed.
Because information saturation and limited attention span, very few people actually read these reports. In fact, 66 % of people prefer to watch a video to learn about a topic rather than read text. This limit the real impact of impart report PDFs.
The gap isn’t in the numbers—it’s in the medium. Generic reports feel irrelevant and rarely get shared. Personalized impact‑report videos make the data instantly relatable, memorable and social‑ready. Think of it as a year‑in‑review personalized video on autopilot.
What changes when you switch to personalized video?
View‑through rates jump from single to double digits. Members instantly see their contribution, not just the organization’s. Social shares multiply your reach—no extra ad spend.
Real‑world proof
A leading organization in sustainability achieved impressive engagement rates through their personalized impact report videos. Open rates reached as high as 64%, with CTA engagement peaking at 89%. Remarkably, in the first 24 hours alone, over 100 members shared their personalized videos on Instagram.
This innovative approach significantly enhanced member engagement, highlighting the powerful potential of personalized video communication to create meaningful interactions. Based on Pirsonal’s B2B2C benchmarks, a single reminder email could further increase shares by an additional 40–70%.
The B2B2C Advantage: Two Brands, One Story
In a B2B2C model the magic happens when your network brand and each member’s local brand show up together in front of the consumer. Personalized video makes that co‑branding effortless.
How it plays out in 30 seconds:
- You (the first “B”) frame the story—mission, credibility, creative polish. All powered by your partner’s data.
- Members (the second “B”) instantly gets a co‑branded version. These data-driven videos show things like their logo, location, and individual results—saving them time and resources while guaranteeing the brand and message land 100 % on point.
- The consumer (“C”) experiences a short, data‑driven clip that feels both trustworthy and locally relevant—so they watch, act, and share.
Why this combo outperforms generic content:
- Trust travels locally. The 2024 Edelman Trust Barometer shows “my employer” (a proxy for community‑level brands) is trusted in 27 of 28 countries, running 14 points higher than “business in general”. (edelman.com)
- Co‑branded content wins the algorithm. An Emplifi study of 1.1 M Instagram posts found collaborative (co‑author) posts deliver ≈2× impressions and interactions compared with solo posts. (emplifi.io)
- Short‑form video rules feeds. HubSpot’s 2025 State of Marketing reports 56 % of marketers rank short‑form video #1 for ROI—and 30 % plan to double spend.
- Personalized video outperforms personalized text content: Research has revealed that, in comparison to personalized text, which is widely utilized in marketing, personalized videos prove to be more impactful in grabbing customers’ attention and motivating them to take action.
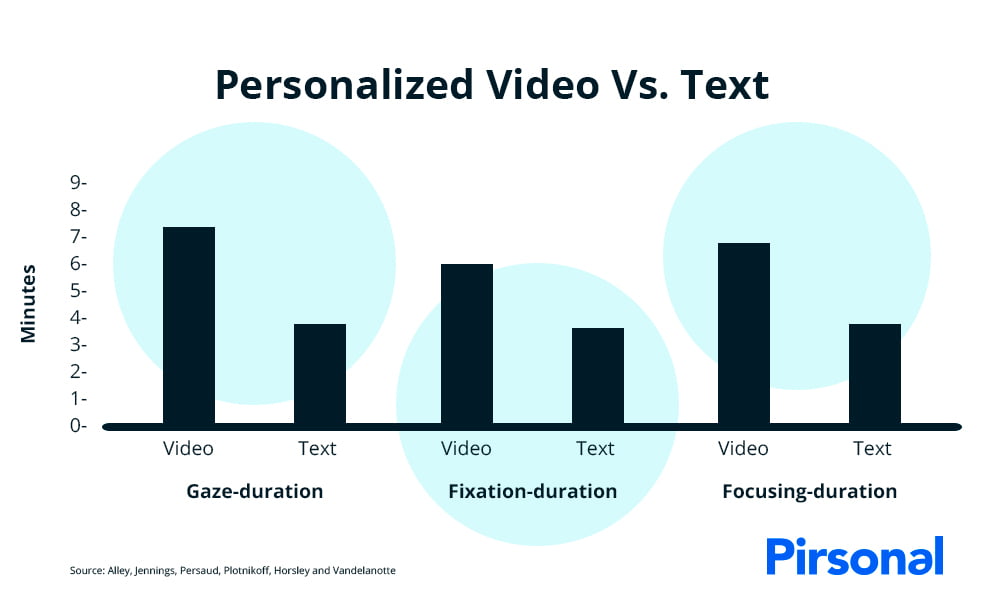
Personalized text Vs. Personalized Video
Bottom line: a 45‑second, co‑branded year‑in‑review personalized video lets your network’s authority and each member’s local trust stack together—cutting through feed fatigue and turning impact metrics into social proof both brands can celebrate.
The Spreadsheet‑to‑Video Workflow (6 Steps)
Below is the six‑step playbook we use with membership brands to turn raw spreadsheets into thousands of co‑branded, share‑ready videos—once your creative template is ready, you can be sending within 12h-72h; most teams complete the entire concept‑to‑launch cycle in 4–6 weeks, largely because of creative production time. Skim the overview, then dive into each step for the details.
- Define strategy & KPIs: Start with clarity. What action do you want members (and their audiences) to take, and how will you measure success?
- Collect and clean member data: Export the metrics, including revenue shared, volunteer hours, and kilograms recycled, into a tidy CSV/XLSX file. Consider how to make this data easily understandable for different audiences. Use the power of data-driven storytelling.
- Design one on‑brand template: Build the creative in Canva, After Effects, or any tool your designer loves. Keep the video under 45 s and use personalization to elevate the story. Need help?
- Map data fields to video layers: Open Pirsonal Editor or Pirsonal Script (both browser‑based) to easily build your automated video template with your dynamic data, think {{Member_Name}}, {{Top_Metric}}, but as layers in the video. With Pirsonal, you can make any video content dynamic, including text, video, image, audio, and properties.
- Bulk‑render at scale: Upload your spreadsheet into Pirsonal Campaign. The platform generates personalized videos, landing pages, and in‑video CTAs—no code, no plugins.
- Distribute, measure & optimize: Each video gets a unique URL. Email, DM, or embed them. Use Pirsonal analytics to see who watched, clicked, and shared, then send automated follow‑ups to non‑engagers.
Personalized Impact‑Report Video Benchmarks
| Metric | First‑send Benchmark | After One Follow‑up |
| Video watch‑rate | 35–55 % | 60–70 % |
| Avg. watch‑time | 68 % of video | 75 % |
| CTA click‑through | 20–30 % | 35–45 % |
| Social shares | 5–7 % of viewers | 10–15 % |
Source: Aggregated Pirsonal client data, 2023–2025.
Why these numbers matter: Most organizations still design personalised reports to impress their members (the second B) while barely considering the audience those members serve. That inside‑out focus typically caps social shares at 10–15 %. Flip the order—start with the consumer (“C”), then the member, and finally your network brand—and share‑rates climb well beyond 15 %.
In fact, TikTok’s What’s Next Report 2025 shows that 45% of social/video platform users say a brand becomes relevant to them when it demonstrates understanding of their needs.
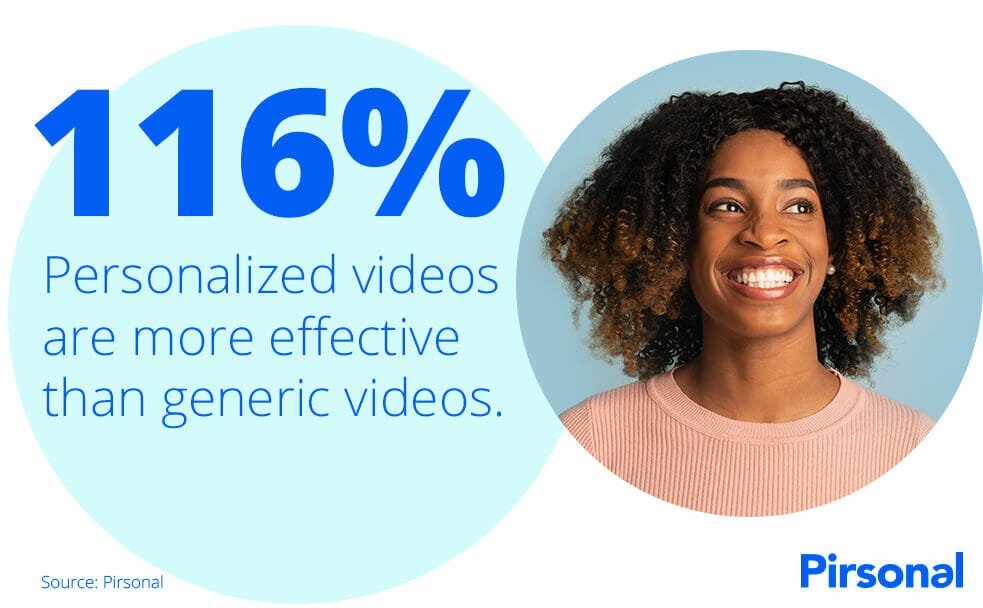
Personalized videos perform better than generic videos in 1:1 marketing
Example: in a summer skin‑care safety collaboration between a global beauty brand and a humanitarian NGO, the master video on YouTube drew 13 000 + views, while hundreds of collaborative, user‑generated versions—boosted by well‑known influencers—pushed total organic reach into the hundreds of thousands.
Best Practices for a Successful Personalized Video Pilot
Thinking of starting small? A well‑run personalized video pilot can validate ROI fast and secure stakeholder buy‑in.
3 Pitfalls That Tank Pilots—and How to Dodge Them
| Pitfall | Quick fix |
| Only “Hi ” personalization | Use AIDA powered by real data: open with a member pain‑point, weave their metric into the midpoint, end with a personalized CTA. |
| Stakeholder silos | Day‑1 kickoff with marketing, creative, data, compliance, IT. Assign owners for story, data fields, voice‑over, sign‑off. |
| Tool without a safety net | Pick a personalized video platform that pairs software with expert assistance—template setup, data mapping, compliance checks—so you’re never stuck. |
90‑Day Pilot Roadmap (1 000–50 000 videos)
- Define 1–2 KPIs (e.g., ≥ 40 % watch‑rate, ≥ 10 % share‑rate).
- Scope pilot volume—start with 10 %-15% of your list or 1,000–50,000 contacts.
- Map data & creative using Pirsonal Editor or Pirsonal Script (or upload Canva layers, After Effects MP4s, etc.).
- Launch & track in real time; review at 30 days.
- Optimize & scale based on analytics and feedback.
Ready‑to‑Use ChatGPT Prompts (Steal These)
Drop any of the prompts below into ChatGPT, Copilot, or Gemini to shortcut planning and production. Each one tackles a real step in the workflow; tweak the wording—or swap in your favourite tools—as you like.
- Prompt 1 – Strategy kickoff: “Create a one‑page brief (SMART goals, KPIs, timeline) for a year‑in‑review personalized video campaign at a membership organization with 10,000 members.”
- Prompt 2 – Data hygiene: “Give me a 10‑item checklist to clean and structure a spreadsheet before uploading it to a video personalization platform (columns like Member_Name, Top_Metric, CTA_URL).”
- Prompt 3 – Story & script ideation: “Looking at the columns in this spreadsheet (or the data points listed below), suggest three creative angles and outline a 30‑second narrative arc—including on‑screen copy placeholders—for a personalized video each member will want to share.”
- Prompt 4 – Creative template: “Outline a Canva storyboard for a 30‑second co‑branded impact video that can be converted into a dynamic template with text, logo, and metric placeholders.
- Prompt 5 – Follow‑up automation: “Draft an email sequence (initial send + 2 nudges) to re‑engage members who watched <25 % of their personalized impact video and didn’t click the CTA, using analytics events as triggers.”
- Prompt 6 – Analytics hand‑off: “Write pseudo‑code to push personalized‑video play and CTA‑click events to Google Analytics 4 via webhook so we can track ROI end‑to‑end.”
FAQ
Can I pull data from Google Sheets instead of Excel?
Absolutely. Export a CSV and upload it to Pirsonal Campaign, or connect Google Sheets through Zapier, Make, Pabbly, or our Video Editing API.
How long does rendering take?
A 60-second video typically renders in 10–20 seconds. Priority queues are available on request.
Do members need special software to watch?
No. Videos play in any modern browser. Pirsonal Player adds interactive CTAs and works on desktop and mobile.
What’s the cost per video?
Subscription plans start at US $2,268 per year and include template onboarding and launch support. Full tiers at pirsonal.com/pricing.
How do I create 10,000 impact-report videos without crashing my laptop?
Pirsonal’s cloud render queue scales across servers, turning thousands of rows into Full-HD MP4s, personalized landing pages, and interactive CTAs—no local strain.
How do I measure ROI beyond watch-rate?
Combine Pirsonal Analytics (watch-time, CTA clicks, shares, downloads) with your CRM to link engagement to KPIs like renewals, upsells, or donations.
Can I design my template in Canva, or do I need After Effects?
Either works. Export layers from Canva or assets from After Effects/Photoshop, then import into Pirsonal. We can also convert Canva designs into dynamic templates at no extra cost on most plans.
Conclusion
Personalized impact‑report videos bridge the gap between data and attention. By starting with member‑audience relevance, layering in brand consistency, and automating video at scale, you can transform overlooked PDFs into social‑ready stories that amplify both your network and every member it serves.
Ready to make your impact report binge‑worthy? Talk to an expert at Pirsonal and see a live demo using your own data. We’ll help you go from spreadsheet to social buzz—fast.